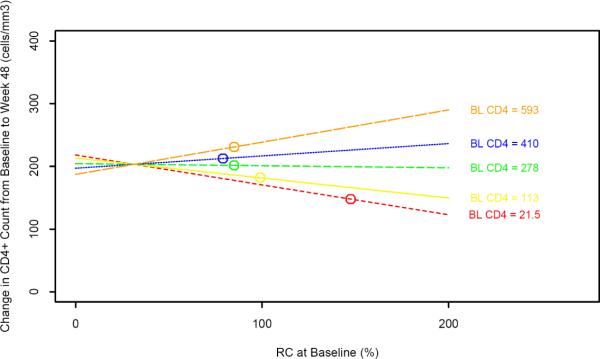
Figure 3B. Fitted Regression Lines for ΔCD448 and RCBL for Various CD4BL Values (restricted to subjects with virologic suppression at week 48).
Fitted regression lines are based on the model described in Table 2 (restricted to subjects with viral suppression at week 48), with controlled BL CD8 count, RNABL, BL CD4 memory count, BL CD4 naive percent at their median values (779 cells/mm3, 4.85 log10 copies/mL, 165 cells/mm3, and 33% respectively), and CD4BL at various values (medians for each of the 5 strata: 21.5, 113, 278, 410, and 593 cells/mm3). Circles represent the model-generated values of ΔCD448 at their median BL RCBL for the 5 strata. When CD4BL = 297, the slope of the fitted regression line is zero. The CD4BL × RCBL interaction was significant (p=0.018), with a positive association between RCBL and ΔCD448 in subjects with higher CD4BL, and a negative association in subjects with lower CD4BL. The lines are drawn beyond the data points used in the model in order to illustrate the relationships among the lines.

