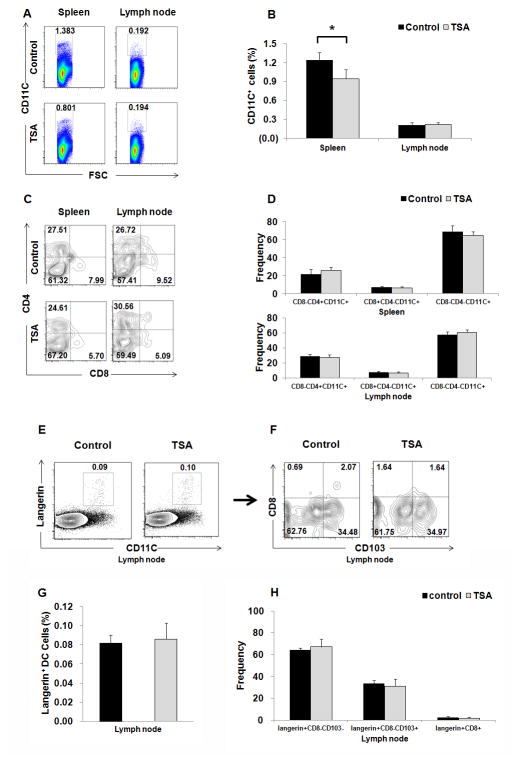
Fig. 3. TSA treatment reduced the frequencies of DCs in spleen during the ACD development, but did not affect the frequencies of migrated epidermal LC and langerin+ dermal DCs in dLNs.
(A) Representative FACS dot plots for CD11C+ cells in spleen and dLNs from ACD mice treated with TSA or DMSO as controls. (B) Summary of data for the frequencies of CD11C+ cells in spleen and dLNs in the two groups, *p<0.05. (C) Representative FACS dot plots for subpopulations of CD11C+DCs based on CD4 and CD8 expression. (D) Summary of data for the frequencies of CD8+CD4−CD11C+, CD8−CD4−CD11C+, and CD8−CD4+CD11C+ cells in spleen and dLNs. (E) Representative FACS dot plots for skin immigrant DCs in dLNs. The migrated epidermal LCs (CD11C+langerin+CD103−CD8−DCs), migrated dermal langerin+ DCs (CD11C+langerin+CD103+CD8−), and LN-resident langerin+ DCs (CD11C+langerin+CD8+) were analyzed on gated Langerin+CD11c+ DCs in dLN. (F) Summary of data for the frequencies of CD11C+langerin+CD8−CD103−, CD11C+ langerin+ CD8− CD103+, and CD11C+ langerin+ CD8+ cells in dLNs. Representative results of three independent experiments are shown. Data are presented as mean ± SD (N=5/group).

