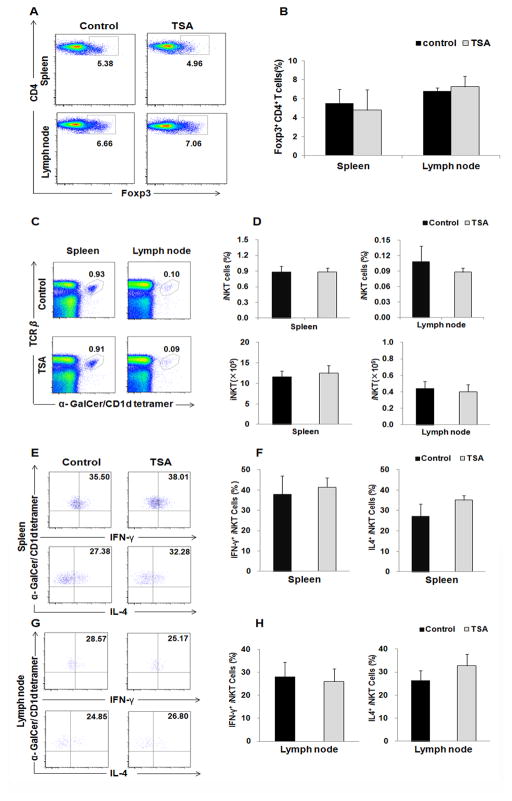
Fig. 4. TSA treatment did not affect the frequencies of Tregs and iNKT cells, as well as the function of iNKT cells.
(A) Foxp3 expression was detected by intracellular staining. Treg cells were identified as CD4+ Foxp3+ cells. (B) Summary plots showing the frequency of CD4+ Foxp3+ T cells from spleen and lymph node, p>0.05. (C, D) The frequency and absolute number of iNKT cells were shown as α-GalCer-loaded CD1d-tetramer+TCRβ+ lymphocytes gated on B220− cells from spleen and lymph node, p>0.05. (E–H) The production of IL-4 and IFN-γ by iNKT cells in spleen (E&F) and lymph node (G&H) was analyzed with intracellular cytokine staining after PMA/ionomycin stimulation for 3h in vitro. Representative results of three independent experiments are shown. Data are presented as mean ± SD. (N=5, P>0.05).

