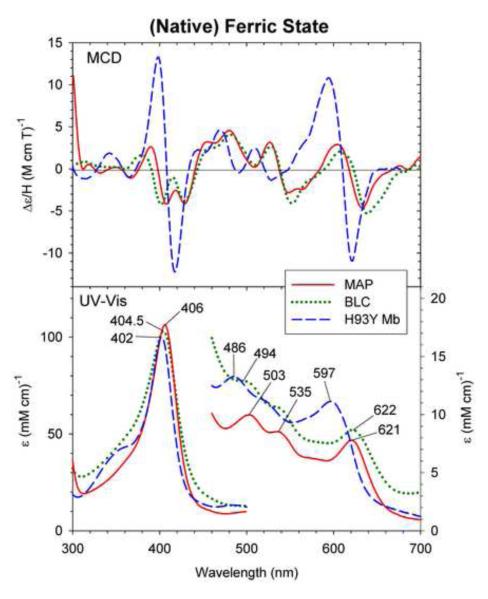
Fig. 2.
MCD and UV-Vis absorption spectra of native ferric Mycobacterium avium ssp. paratuberculosis protein-2744c (MAP) (solid line), bovine liver catalase (BLC) (dotted line) and ferric H93Y Mb (dashed line). The spectra of MAP was measured in 50 mM Tris, pH 7.5 containing 150 mM NaCl at 4 °C. The spectra of BLC and H93Y were replotted from refs. [13] and [19], respectively.

