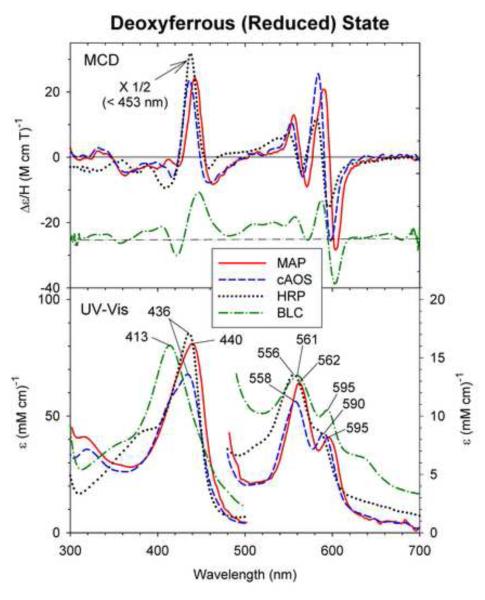
Fig. 5.
MCD and UV-Vis absorption spectra of dithionite-reduced (deoxyferrous) cAOS (solid line), MAP (dashed line), BLC (dot-dashed line) and HRP (dotted line). The deoxyferrous cAOS and MAP spectra were measured in 70/30 (v/v) mixture of glycerol and 50 mM Tris, pH 7.5 containing 150 mM NaCl, at 4 °C and deoxyferrous HRP spectra were measured in 100 mM potassium phosphate buffer, pH 7.0, at 4 °C (the MCD spectrum replotted from ref. [20]. The spectra of BLC were recorded in at 4 °C under the conditions described in the materials and methods section. The ordinate for the MCD spectrum of BLC is offset downward by Δε/H = 25 M−1 cm−1 T−1 for clarity.

