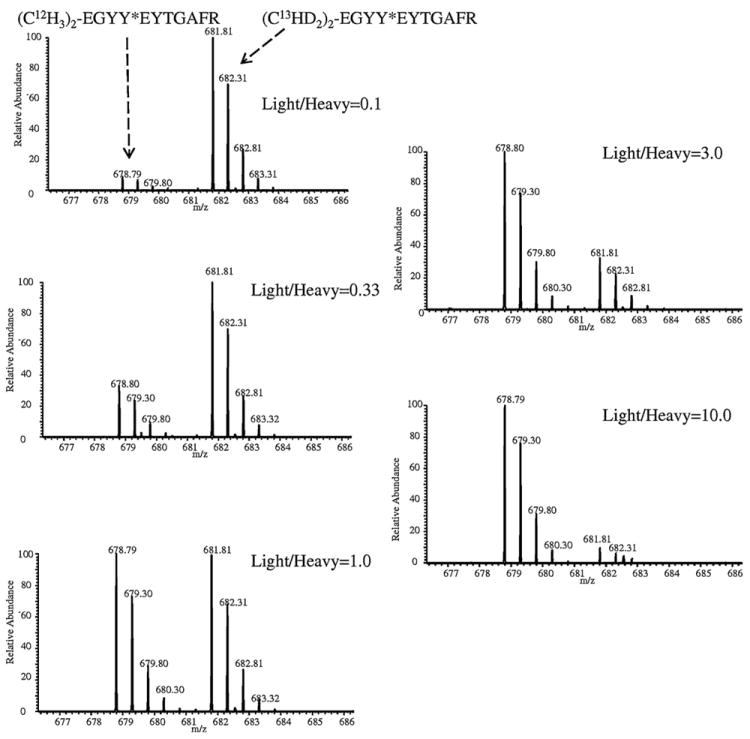
Fig. 4.

[M+2H]2+ molecular-ion region of the full scan ESI mass spectrum for #EGYY*GYTGAFR differentially labeled with N-dimethylation in various (1:10, 1:3, 1:1, 3:1 and 10:1) molar ratios (* represents nitrotyrosine, and # denotes either light or heavy N-dimethyl label).
