
Figure 2.
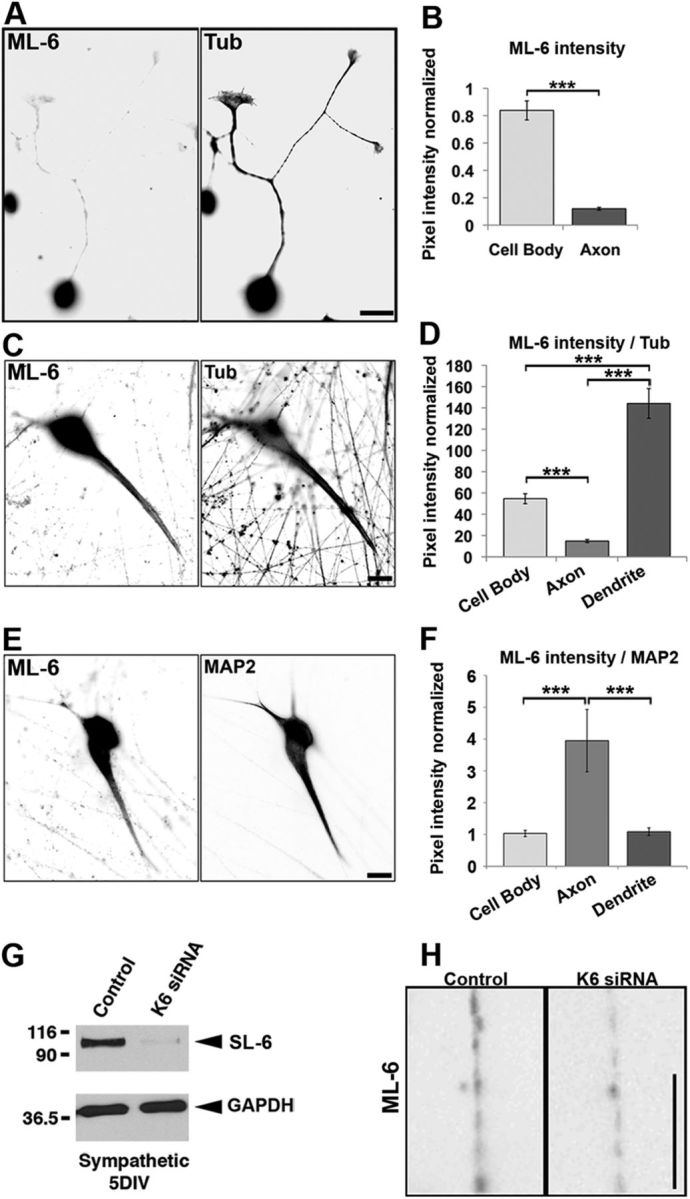
Kinesin-6 distribution in neurons. SCG neurons were cultured for 24 h or 7 DIV, fixed with cold methanol, and double labeled with ML-6 and the β-III tubulin (Tub) antibodies (A–D) or double labeled with ML-6 and MAP2 antibodies (E, F). Fluorescence images are presented in an inverted format that converts blacks to whites and whites to blacks and inverts gray levels proportionally. A, At 24 h, ML-6 strongly labels the cell body, but labeling in the axon is barely detectable. Scale bar, 10 μm. B, Quantification of ML-6 labeling intensity in axons shows very little signal in the axon relative to the cell body. Data are represented as mean ± SEM intensity ratio (relative to β-III tubulin, minus the secondary antibody background): cell body intensity = 0.84 ± 0.07; axon intensity = 0.12 ± 0.01 (n = 20, p < 0.001). C, At 7 DIV, ML-6 localizes strongly to the cell body and dendrites, but axons remain dim by comparison. Scale bar, 20 μm. D, Quantification of ML-6 labeling intensity ratioed to β-III tubulin shows significantly higher cell body labeling than axonal labeling and significantly higher dendritic labeling than cell body labeling. Data are represented as mean ± SEM intensity ratio ML-6/β-III tubulin (minus the secondary antibody background): cell body intensity = 54.61 ± 4.70 (n = 23); axon intensity = 14.76 ± 1.44 (n = 23, p < 0.001); dendrite intensity = 144.12 ± 14.00 (n = 23, p < 0.001). E, At 7 DIV, neurons double labeled for MAP2 and ML-6 show somatodendritic enrichment of both, with the compartmentation appearing to be somewhat more robust for MAP2 than kinesin-6. Scale bar, 20 μm. F, Quantification of ML-6 labeling intensity ratioed to MAP2 shows significantly greater MAP2 labeling in axons compared with cell bodies or dendrites. Data are represented as mean ± SEM intensity ratio ML-6/MAP2 (minus the secondary antibody background): axon intensity = 3.95 ± 0.98 (n = 20); cell body intensity = 1.03 ± 0.09 (n = 20, p < 0.001); dendrite intensity = 1.09 ± 0.12 (n = 20, p < 0.001). G, The 5 DIV cultures transfected with either control siRNA or kinesin-6 siRNA at plating and collected for Western blot analysis. Blots probed with SL-6 show that kinesin-6 remained thoroughly depleted at 5 DIV. Comparable results were obtained with the ML-6 antibody (data not shown). Note that the SL-6 antibody produces a single band in rat neurons, indicating that the MKLP1 isoform of kinesin-6 is not expressed in neurons or expressed at levels beneath detection. H, Magnified (inverted) images of axonal regions of a control siRNA neuron and a kinesin-6 siRNA neuron labeled with ML-6. Intensity is only marginally lower in the latter compared with the former, suggesting that the faint signal observed in axons may be attributable at least in part to nonspecificity in the primary antibody, when used for immunolabeling. Scale bar, 5 μm.