
FIG 4.
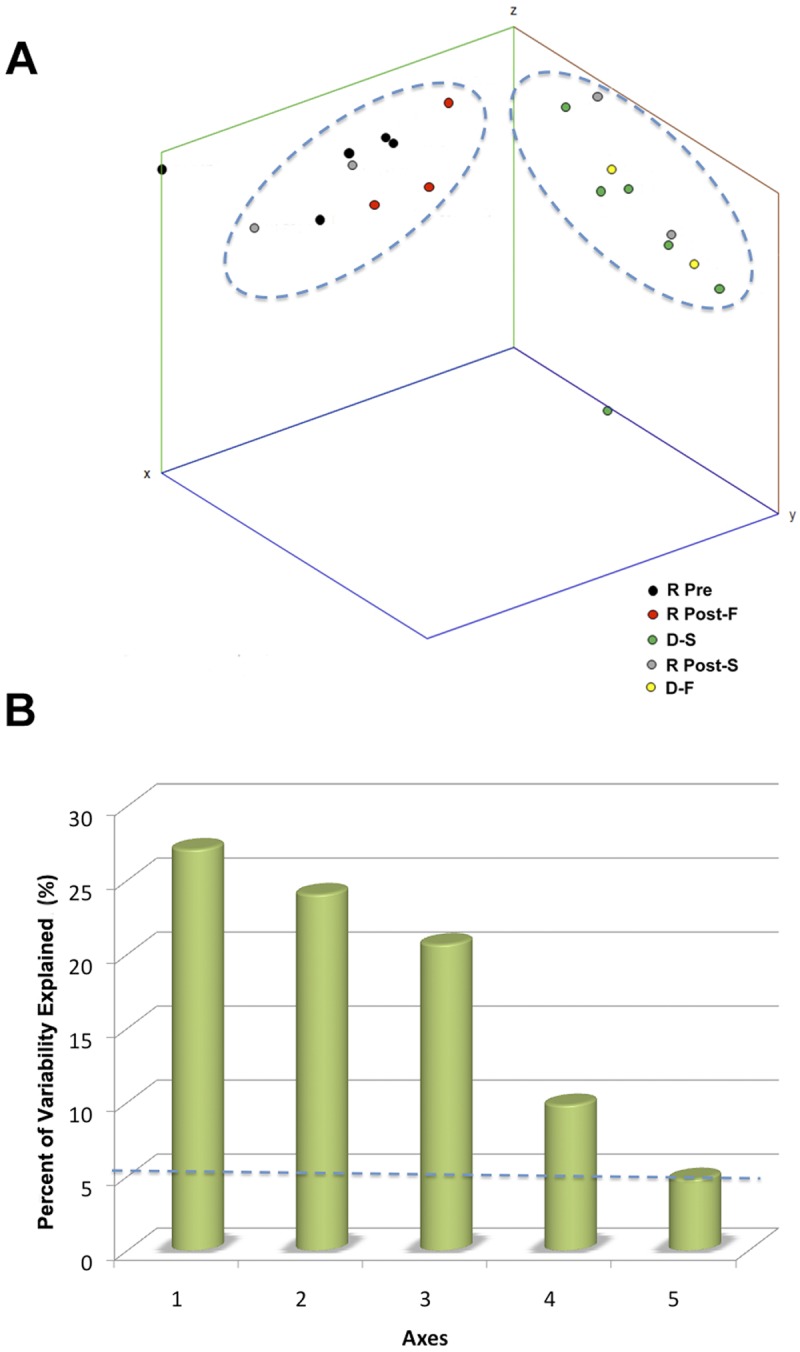
(A) PCoA. PCoA represents multivariate analysis, which explores community similarity by measuring phylogenetic branch length (UniFrac) of 16S rRNA tag sequences. The dots represent the projected shadows of the samples on the respective two-dimensional planes (xy, blue; yz, red; xz, green). The x axis, y axis, and z axis represent 27.1%, 24.0%, and 20.7% of the intersample variability, respectively. R Pre, recipient pre-FT; R Post-F, recipient post-failed FT; D-S, donor of successful transplant; R Post-S, recipient post-successful FT; D-F, donor of failed transplant. (B) PCoA axes in relation to observed variability. The percentage of variability observed is depicted in relation to the first five axes. The dashed line at 5.26% represents the amount of variability expected for each axis based on random events.