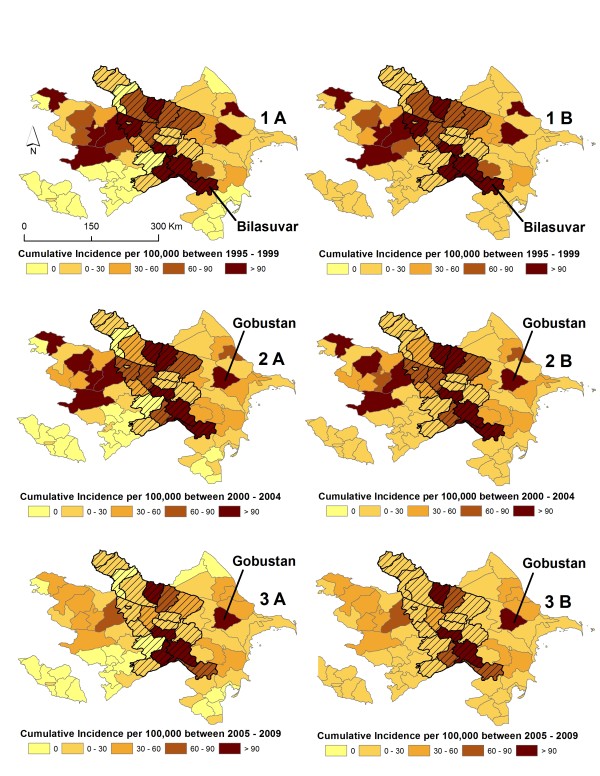
Figure 3.
Spatial distribution of cumulative incidence estimates during the study period 1995 to 2009. Cumulative estimates were calculated for three equal 5-year periods. The maps display period 1 (1995 to 1999), period 2 (2000 to 2004), and period 3 (2005 to 2009). Insets A refer to crude cumulative incidence estimates for each time period and insets B refer to Empirical Bayes smoothed (EBS) estimates for each time period. Cross-hatching overlain on maps depicts the Central dummy region of Azerbaijan. During period 1 cumulative incidences ranged between 0 to 415.0 cases per 100,000 persons with the highest rate occurring in Bilasuvar (95%CI : 368.9, 465.4), period 2 cumulative incidences that ranged between 0 to 386.5 cases per 100,000 persons with the highest rate occurring in Gobustan (95%CI : 324.5, 456.9), and period 3 Cumulative rates during period 3 ranged between 0 to 283.4 cases per 100,000 persons with the highest incidence again occurring in Gobustan (95%CI : 232.2, 342.8).

