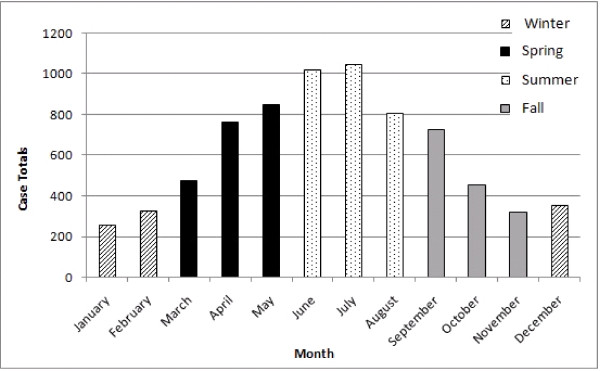
Figure 6.
Total number of human brucellosis cases by month and season. Winter months (n = 1,000) are shown in the graph by cross-hatched bars, Spring months (n = 2,228) are displayed by the solid black bars, Summer months (n = 3,131) are represented by dotted bars, and Fall months (n = 1,624) are displayed by the solid grey bars.

