
Figure 1.
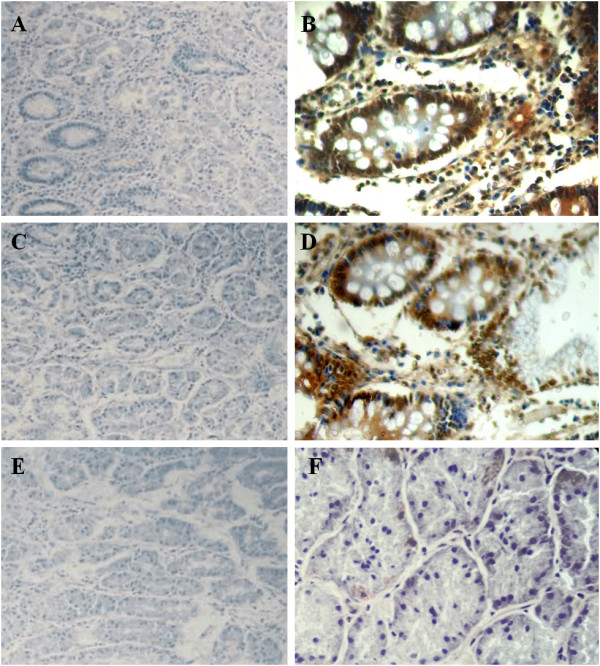
Immunostaining of hTERT, MYC and p53. (A) Absence of hTERT staining in atrophic gastritis (100×); (B) hTERT immunoreactivity in intestinal metaplasia (400×); (C) Atrophic gastritis without MYC immunoreactivity (100×); (D) MYC immunopositivity in intestinal metaplasia (400×); (E) Absence of p53 immunoreactivity in atrophic gastritis (100×); (F) negative control (400×).