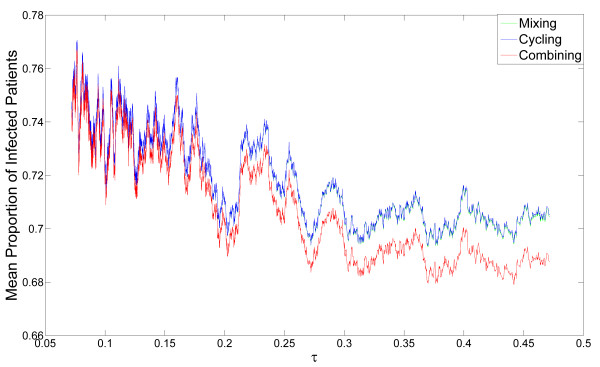
Figure 4.
Robustness of the dynamics describing proportion of infected patients. The dynamics described in E1 were studied for 104 random sets of parameters (derived from distributions described in the main text). The moving average of the emergence of double resistance (see Methods) is plotted as a function of the rate of clearance due to antibiotic usage (τ). Note that the same data sets are used for a given value of τ under each of the three strategies, generating an association between the curves. The moving average of mixing is plotted in green, of cycling in blue, and of combining in red. When the values of the moving average for mixing and cycling are very close, only the blue curve is visible. We can see that combining is the most efficient strategy in reducing the proportion of infected patients. When the rate of clearance due to antibiotics, τ, increases, the relative efficiency of combining increases , while the proportion of infected patients decreases.

