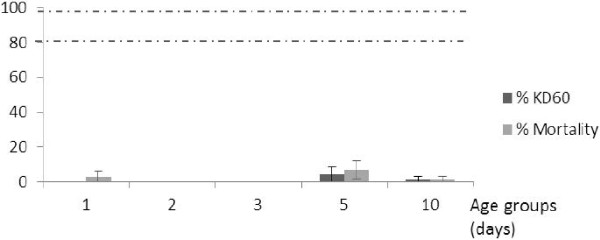
Figure 3.
Knockdown and mortality rates following exposure to DDT of different ages of wild An. gambiae mosquitoes. Vertical lines on top of the bars represent confidence intervals. Dotted lines represent upper (98%) and lower (80%) cut-offs for WHO classifications; values above the upper line indicate susceptibility, values within the two lines indicate possible resistance and values below the lower line indicate confirmed resistance (WHO, 1998).

