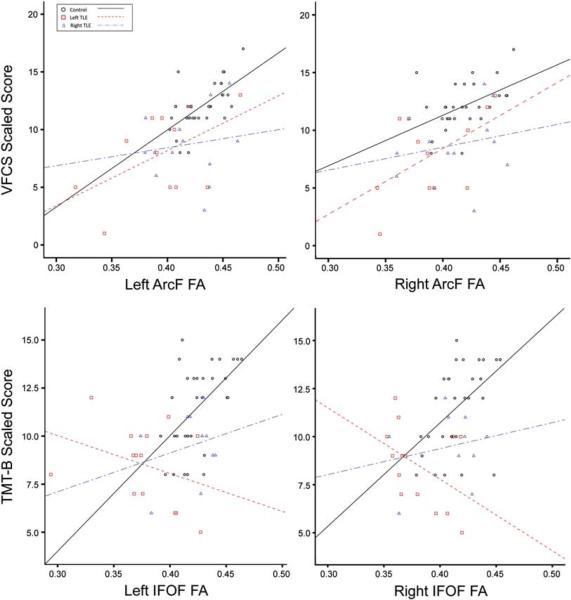
Fig. 2.
Scatter plots showing significant fiber FA and task-switching performance association. Top row shows the relationship between TMT-B performance and IFOF FA. Bottom row shows the relationship between VFCS and ArcF FA. Circles show values for health controls; squares for left TLE patients; triangles for right TLE patients. Best fit lines (solid: controls; dashed: left TLE patients; dotted-dashed: right TLE patients) approximate the correlational relationships per group. In both cases, a significant FA-task-switching performance is observed only for healthy controls.

