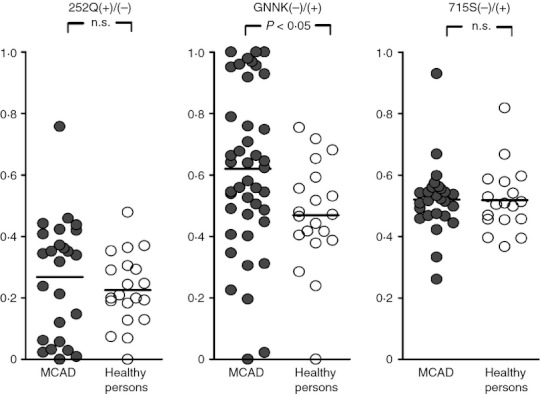
Figure 1.

Distribution of the following ratios: (i) of Q252(+)/Q252(−) expression intensity (i.e. the amount of PCR amplification product with and without the additional glutamine residue [Q]); (ii) of the GNNK(–) isoform compared to the GNNK(+) isoform [i.e. the amount of PCR amplification product without and with the tetrapeptide sequence glycine-asparagine-asparagine-lysine (GNNK)]; and (iii) of S715(−)/S715(+) expression intensity (i.e. the amount of PCR amplification product with and without the serine residue [S]). Comparison of the distribution of the ratios between patients with systemic mast cell activation disease (MCAD, filled symbols) and healthy probands (healthy persons, open symbols). Ordinate: Ratio of the expression intensities. The black bars represent the respective mean. P < 0·05, Fisher′s exact test; n.s., not significant.
