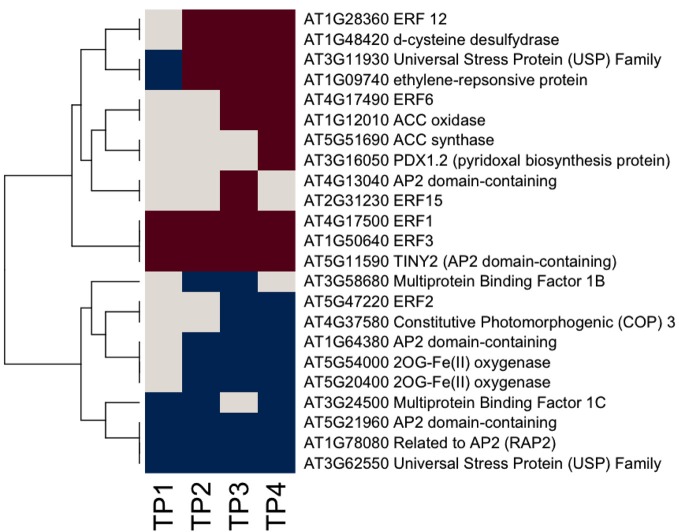
Figure 5.
Ethylene-related gene responses across the time course of winter hardening. The gene expression levels across the rows are hierarchically clustered. Magenta cells represent significant positive expression changes, blue cells represent significant negative changes, and off-white cells represent no change or no statistically significant change.

