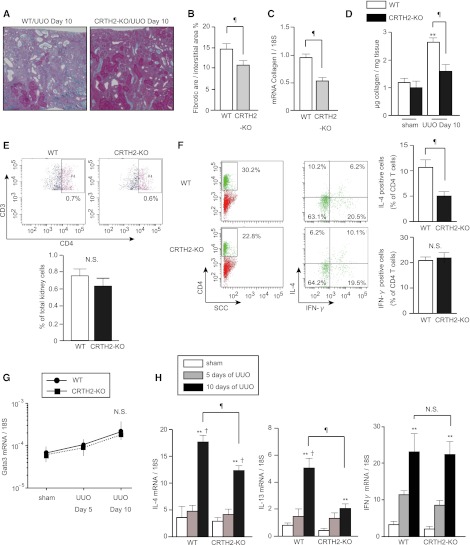
Figure 4.
UUO-induced Th2 lymphocyte activation and interstitial fibrosis are blunted in CRTH2-KO mice. (A) Representative images of Azan staining of UUO kidneys from WT and CRTH2-KO mice. (B) Quantitative assessment of the fibrotic area. (C) Collagen I mRNA expression, as determined by quantitative RT-PCR. (Values show relative expression compared with that in WT mice.) (D) Comparison of soluble collagen content in the cortex of WT and CRTH2-KO mice. (E) Proportion of CD3+/CD4+ cells in WT and CRTH2-KO mice on day 10 after UUO. Data are representative of two independent experiments. (F) Percentage of IFN-γ–producing Th1 and IL-4–producing Th2 cells in CD4+ T cells infiltrating into the cortex of WT and CRTH2-KO mice. (Values are representative of three independent experiments.) Data are the mean ± SD (n=5 in each group). ¶P<0.05 versus WT; **P<0.05 versus sham (two-sided t test); †P<0.05 versus day 5 (one-way ANOVA). (G and H) Time course of changes in (G) Gata3 and (H) IL-4, IL-13, and IFN-γ mRNA expression in the cortex of WT and CRTH2-KO mice.

