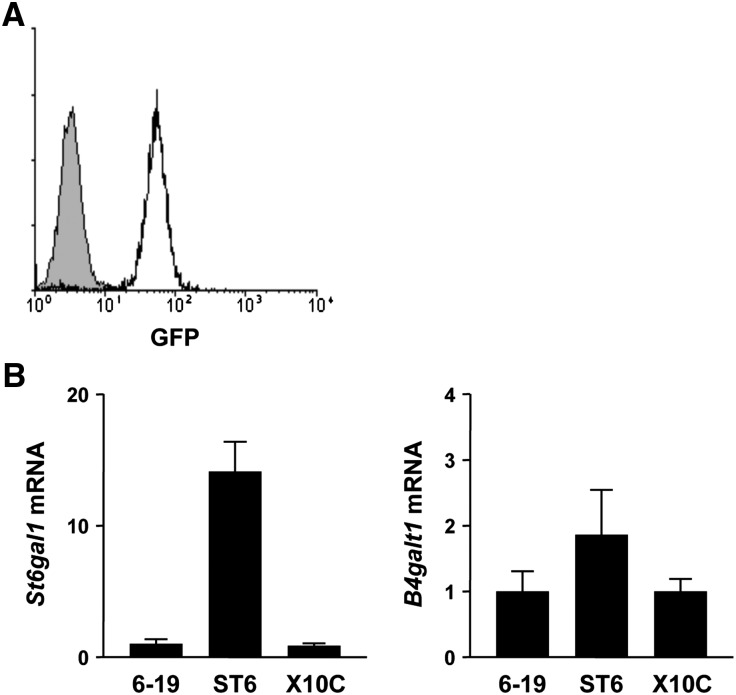
Figure 4.
Increased levels of St6gal1 mRNA in 6-19.ST6-5 hybridoma cells as compared with wild-type 6-19 and X10C cells. (A) Expression of GFP in 6-19.ST6-5 cells was determined by flow cytometric analysis. Shaded area indicates the background obtained with parental 6-19 hybridoma cells. (B) Levels of St6gal1 and B4galt1 mRNAs in 6-19, 6-19.ST6-5, and X10C cells were quantified relative to a standard curve generated with a reference cDNA preparation and normalized using TATA-binding protein mRNA. Results (means of three different preparations of each cell type ± SEM) are expressed as fold increases relative to 6-19 hybridoma cells.

