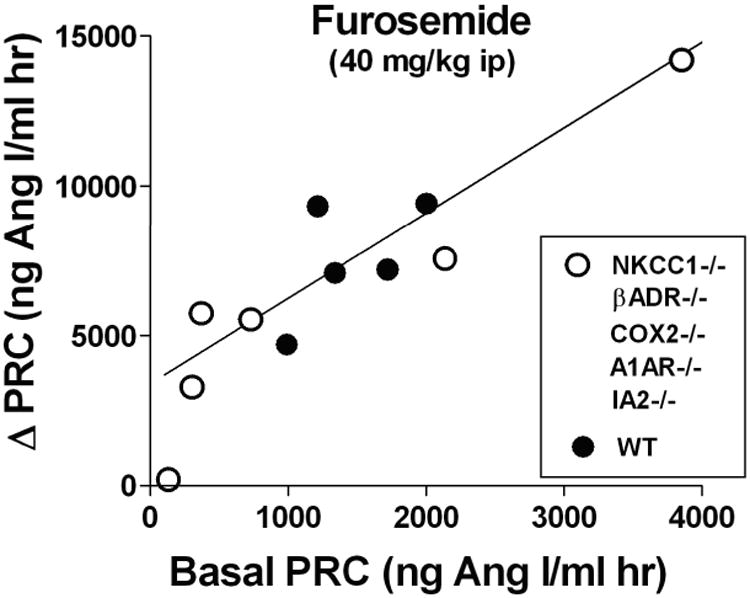
Fig. 3.

Relationship between basal plasma renin concentration (PRC) and the increase (Δ) of PRC caused by intraperitoneal injection of 40 mg/kg furosemide.
Each symbol is the mean value of 5-10 measurements of PRC in wild type (black dots) and various mutant mouse models (open circles; mutants are used to extend the limited range of basal PRC in wild type to the higher values of NKCC1-/- and the lower values of the other mutant strains). Data are taken from references 37, 61, 71, 77, 94.
