
Figure 8.
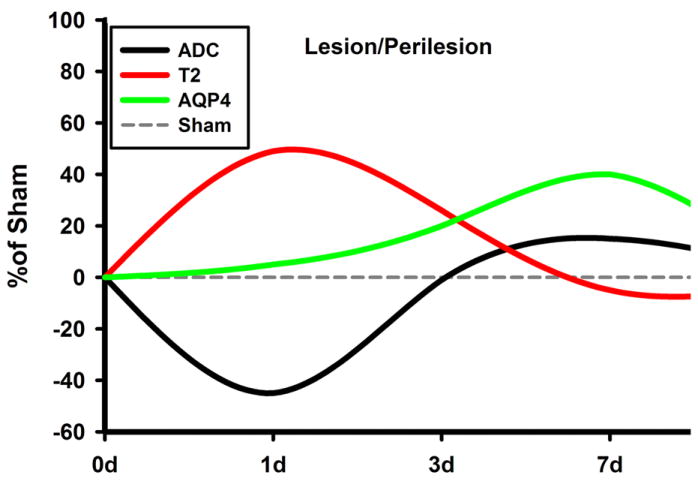
Summary Schematic of the Relative Changes in ADC, T2, and AQP4 at the region encompassing the site of impact: The values are normalized to the sham values, which is set at 0%. Notice the initial decrease of ADC and increase of T2, accompanied by a gradual increase in AQP4 values. As AQP4 increases, T2 and ADC start to normalize, signifying a possible resolution of edema.
AQP4, aquaporin 4; d, days post injury; ADC, apparent diffusion coefficient