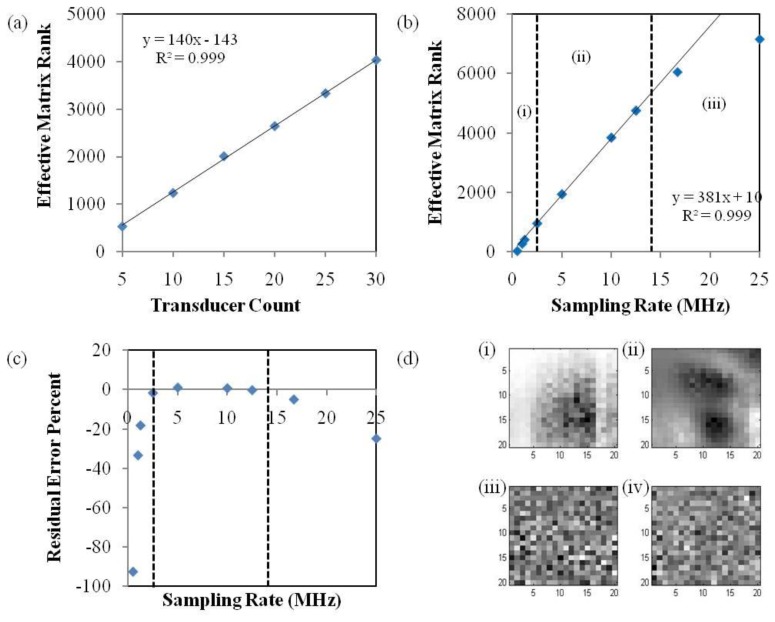
Fig. 2.
(a) Displays the estimated matrix rank for variable transducer count and arrangements. (b) Displays the estimated matrix rank for variable measurement space temporal sampling rates. Linear regression for (b) was performed only on the 4 data points contained within region (ii). The line is shown throughout the entire figure to show the expected value of the matrix rank. (c) Compares the expected matrix rank to the measured rank and is plotted as a percent error to highlight the deviation from linearity in regions (i) and (iii). (d) Provides a visual interpretation of the geometry associated with selected singular vectors for the imaging operator corresponding to the 30 transducer, 5 MHz temporal sampling rate. Images (i) through (iv) correspond to singular vectors of index 1, 10, 3632, and 4036.

