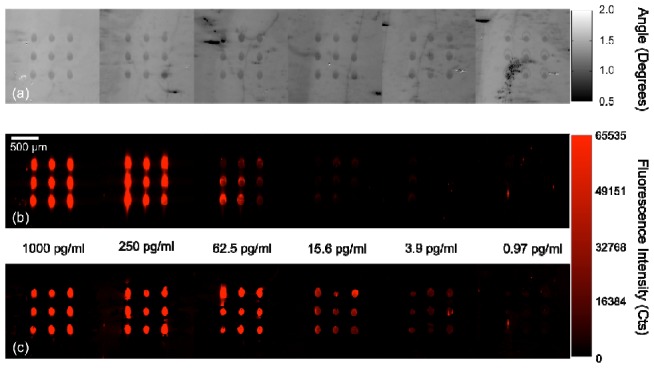
Fig. 6.

TNF-α detection performed on a PC using a sandwich ELISA assay. The antigen concentration decreases from left to right. (a) Label-free image of the PC surface showing the presence of capture antibody spots on the sensor. (b) Fluorescence detection at a single resonance angle of 10° after assay is completed. (c) Fluorescence detection using the masked detection for the same PC surface showing improved contrast, recognition and uniformly higher fluorescence output.
