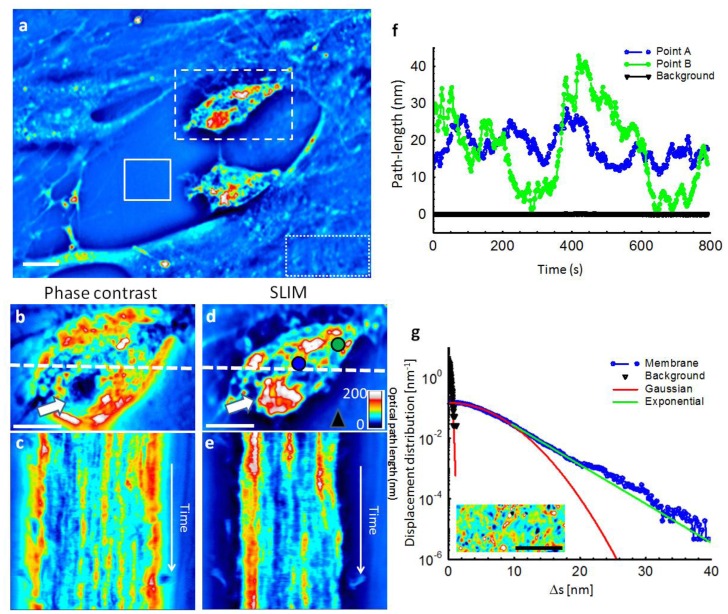
Fig. 6.
( Media 2 (10MB, MOV) ) SLIM dynamic imaging of mixed glial-microglial cell culture. Two reactive microglia probe neighboring cellular environments with highly dynamic lamellipodia and begin engulfing matter through long, thin projections in serum-starved primary mixed glial cultures. Actin polymerization and depolymerization are evident in the membrane area. SLIM reveals changes in optical path length of these dynamic cellular behaviors. Objective: Zeiss EC Plan-Neofluar 40 × /0.75. (a) Phase map of two microglia cells active in a primary glial cell culture. Solid line box indicates the background used in (g), dashed line box delineates a reactive microglial cell used in (b)-(e) and dotted line box indicates the glial cell membrane used in (g). (b) Phase contrast image of the cell shown in (a). psuedocoloration is for light intensity signal and has no quantitative meaning for phase contrast. (c) Registered time-lapse projection of the corresponding cross-section through the cell as indicated by the dash line in (b). (d) SLIM image of the cell in (b); the fields of view are the same. The arrows in (b) and (d) point to the nucleus which is incorrectly displayed by phase contrast as a region of low signal. (e) Registered time-lapse projection of the corresponding cross-section through the cell, as indicated by the dash line in (d). (f) Path-length fluctuations of the points on the cell (indicated in d) showing intracellular motions (blue- and green-filled circles). Background fluctuations (black) are negligible compared to the active signals of the microglia. (g) Semi-logarithmic plot of the optical path-length displacement distribution associated with the glial cell membrane indicated by the dotted box in (a). The solid lines show fits with a Gaussian and exponential decay, as indicated in the legend. The distribution crosses over from a Gaussian to an exponential behavior at approximately 10 nm. The background path-length distribution, measured from the solid line box, has a negligible effect on the signals from cells and is fitted very well by a Gaussian function. The inset shows an instantaneous path-length displacement map associated with the membrane. Scale bars, 10 μm (a), (b), (d) and (g).

