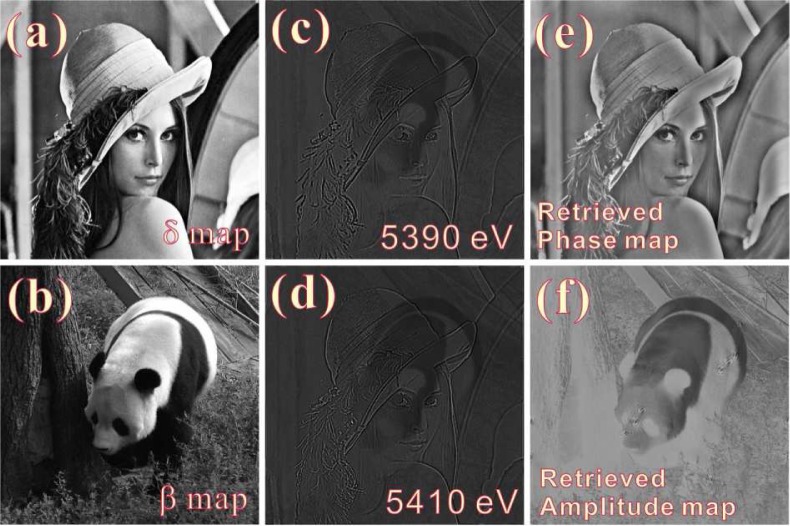
Fig. 3.
Computer simulation for the proposed experimental scheme and the phase retrieval algorithm. The distribution of the real and imaginary part of the refractive index are presented in panels (a) and (b) respectively. Panels (c) and (d) are the intensity distributions at the detector plane under X-ray illumination at 5390 eV and 5410 eV respectively. The retrieved phase map and amplitude map are shown in panels (e) and (f).

