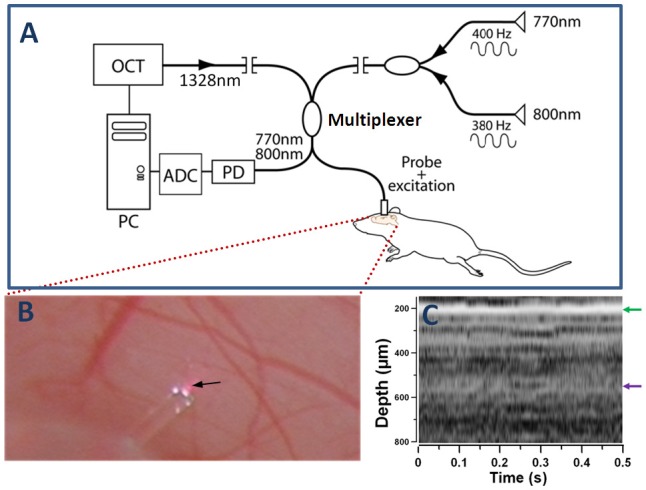
Fig. 1.

DWP-OCT for in vivo SaO2 measurements (A), exposed brain cortex and the probe on top of an indicated by arrow 30-µm diameter arteriole (B) and M-mode OCT image recorded from a probed site (C). Optical pathlength changes (op) in a selected arteriole induced by photothermal excitation wavelengths 770 nm (op1) and 800 nm (op2) are measured by DWP-OCT and converted to SaO2 levels. Red spot under the probe (B) is specular reflection of photothermal excitation light from tissue. White spots on the fiber probe are photographic artifacts due to multiple reflections between the fiber and aluminum fiber holder. OCT-signal intensity A-scans of the M-mode image (C) calculated as a 20Log of Fourier transformation of one laser sweep interference fringes between SMF-28 fiber end face and brain tissue. The green arrow (C) indicates position of the cover glass/cortex boundary, while the purple arrow indicates depth location of the arteriole (350 µm below the glass cortex boundary, 550 µm below fiber endface) extracted from speckle contrast and Doppler M-mode images (Fig. 2).
