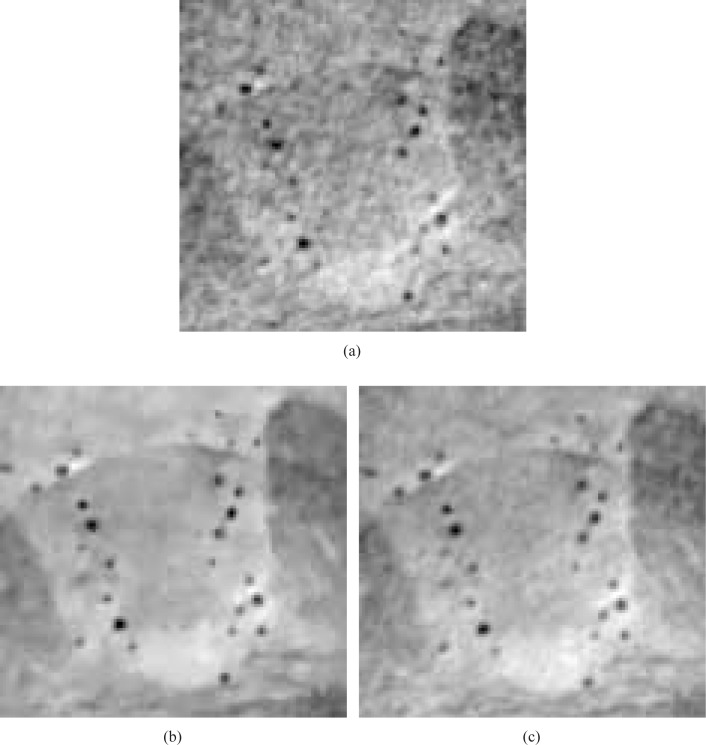
Fig. 16.
Zoomed-in images of the smaller ROIs denoted in Figs. 14(a) and (b), reconstructed from 180 view angles, are displayed in subfigures (a) and (b). Subfigure (c) displays the corresponding reference ROI corresponding to an image reconstructed from 720 projections by use of a DPCT FBP algorithm. All images are displayed in the same grey scale window [0 1].

