
Fig. 2.
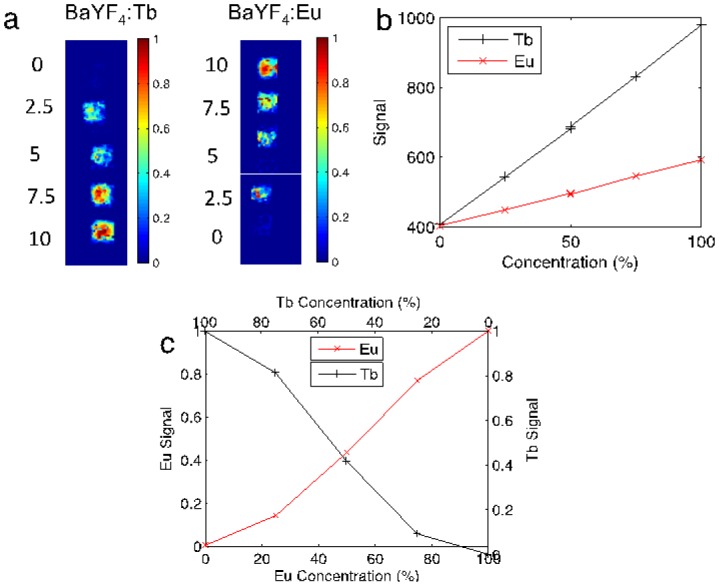
(a) Shown are the Ba0.55Y0.3F2:Tb3+ and Ba0.55Y0.3F2:Eu3+ phosphor concentrations with increasing/decreasing concentration (top-to-bottom) of Ba0.55Y0.3F2:Tb3+ / Ba0.55Y0.3F2:Eu3+, respectively. (b) The raw signal detected for each respective nanophosphor. (c) The relative median recovered concentration in each ROI plotted with respect to concentration.