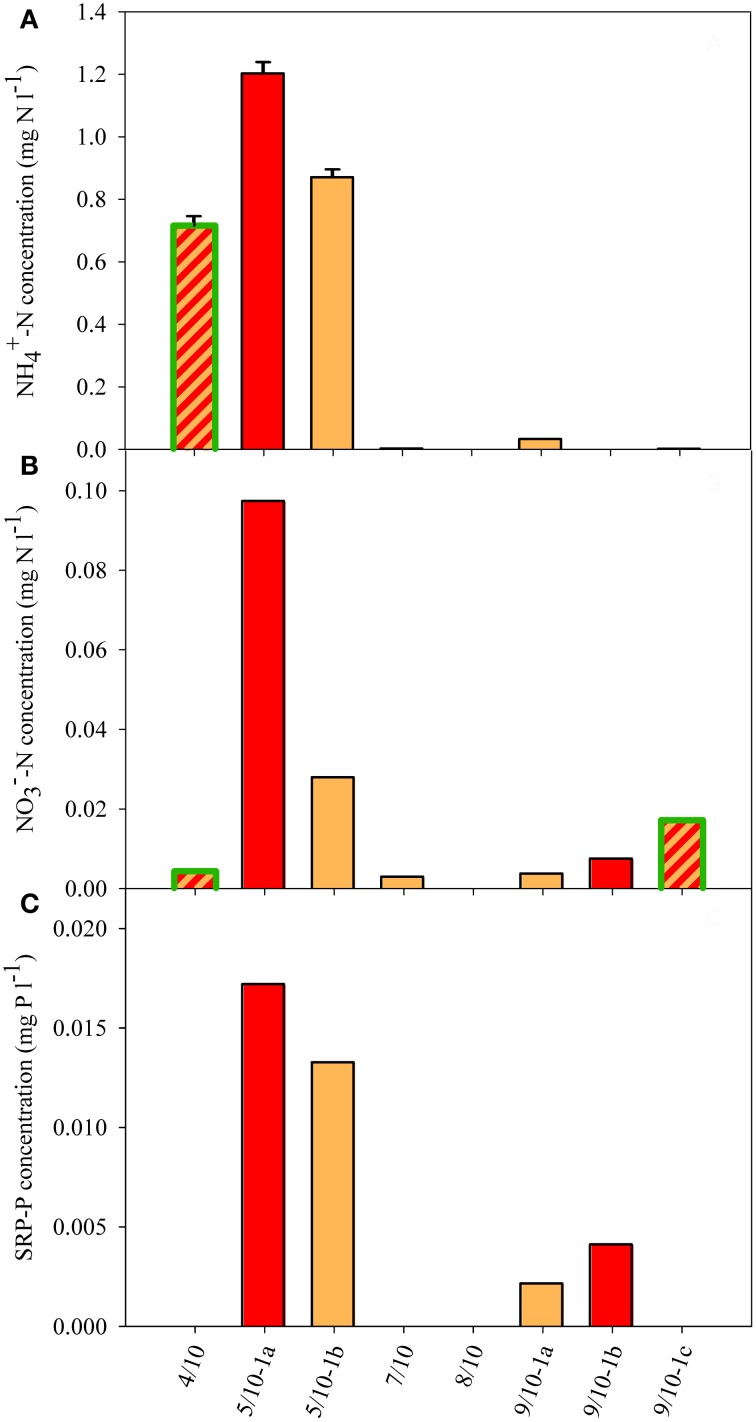
Figure 4.
Dissolved nutrient concentration in the snow of eight sample sites. (A) NH+4, (B) NO−3, and (C) SRP concentrations. If no value is shown, no concentration could be detected. The SD shown in panel (A) reflects the variation resulting from dilution. White snow contained 0.002 mg NH+4−N l−1, 0.002 mg NO−3−N l−1, and 0.002 mg SRP-P l−1. Color fill of the different bars reflect the color of snow community listed in Table 1. Highlighted green edges of bars indicate the presence of green cells.

