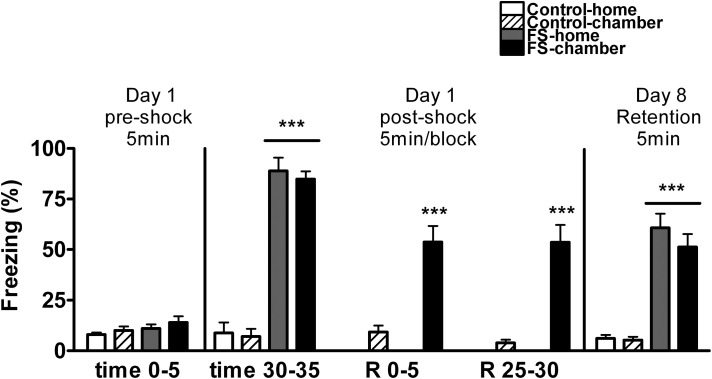
Figure 2.
Percentage of time spent freezing for Experiment 1 on day 1 (pre-shock period and several post-shock periods), and day 8 (retention). Means and SEM are represented. The groups were as follows: control-home, not shocked during the 35 min exposure to the shock chamber and returned to the home-cage after that; control-chamber, not shocked during the 35 min in the chamber and maintained in the shock chamber for an additional period of 30 min (R 0–30); FS-home, shocked in the chamber and returned to their home-cages after that; FS chamber, shocked in the chamber and maintained in the shock chamber for an additional period of 30 min without shocks. ***p < 0.001 vs. control groups.

