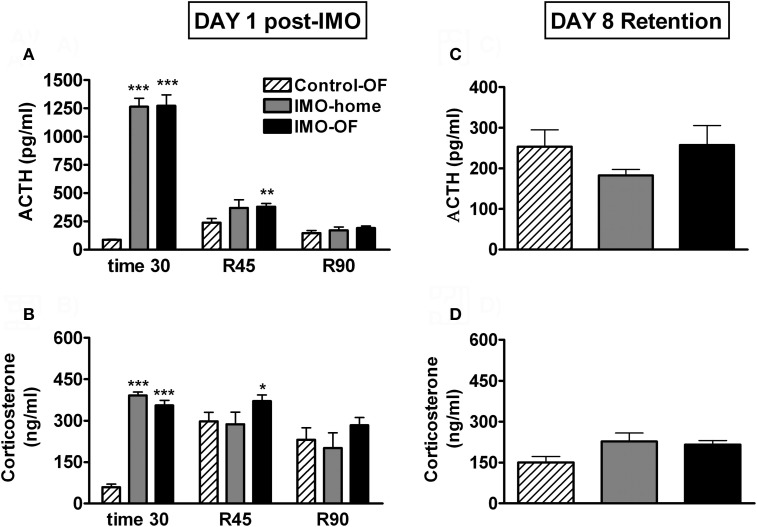
Figure 5.
Plasma ACTH and corticosterone levels for Experiment 2. Means and SEM are represented. The groups were: control-OF, which were exposed to the OF for 5 min, left undisturbed in their home-cages in the animal room for 25 min and then returned to the OF for an additional 90 min period (R 0–90); IMO-home, which were allowed to explore the OF for 5 min, then exposed to IMO inside the OF for 25 min and finally returned to their home-cages in the animal room; and IMO-OF groups, which were treated as the previous group but were released from the IMO board and maintained in the same OF for an additional post-IMO period of 90 min. Panel (A and B) show hormone levels on day 1, just after IMO (time 30) and at 45 and 90 min after IMO (R45 and R90). Panel (C and D) show hormone levels on day 8 (retention). *, **, ***: p < 0.05, p < 0.01 and p < 0.001 vs. control-OF group.

