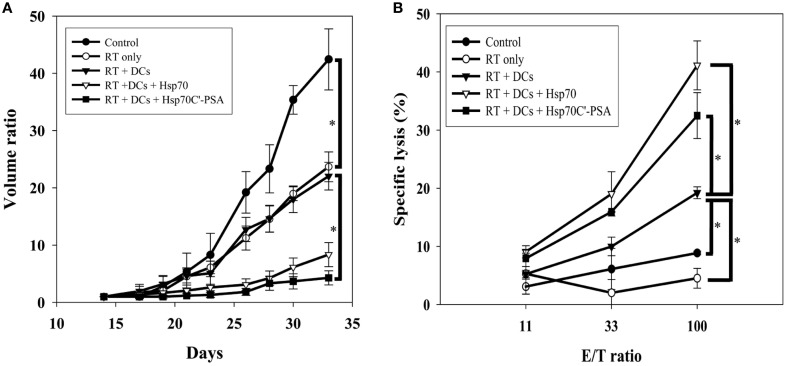
Figure 3.
Tumor growth inhibition, tumor-specific CTLs and tumor CD3+ T cell infiltration assay. (A) Mice were injected with 1 × 10⁵ CT26/PSA tumor cells s.c. on day 0 and treated with 8 Gy of RT on day 14 followed by immunotherapy in different groups. Each treatment group included 6 mice. Mean volume ratio, with SD for each group, is plotted vs. days after tumor-cell inoculation. (B) Seven days after treatment immunotherapy, splenocytes were harvested for CTLs assay. The cytotoxic activity of the splenocytes were determined by 51Cr-release assay at various effector/target cells (E/T) ratios. The data are shown as the mean specific lysis ± SD for three experiments. *Indicates p < 0.05.

