
Figure A3.
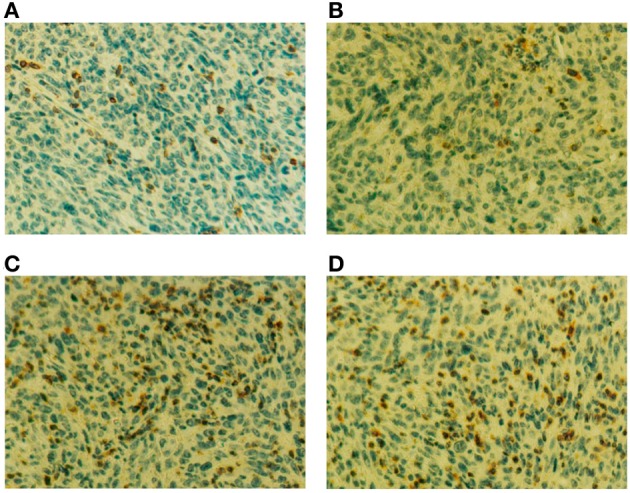
(A–D) Four days after RT-DC immunotherapy, the tumor were removed and analyzed by immunohistochemistry. CD3+ T cell infiltration is seen as brown spots in the section counterstained with hematoxylin (magnification, 400 ×). Sections are from mice treated with PBS (A), BM-DCs alone (B) or BM-DCs plus 50 μg of rHsp70 (C) or rHsp70C′-PSA (D).