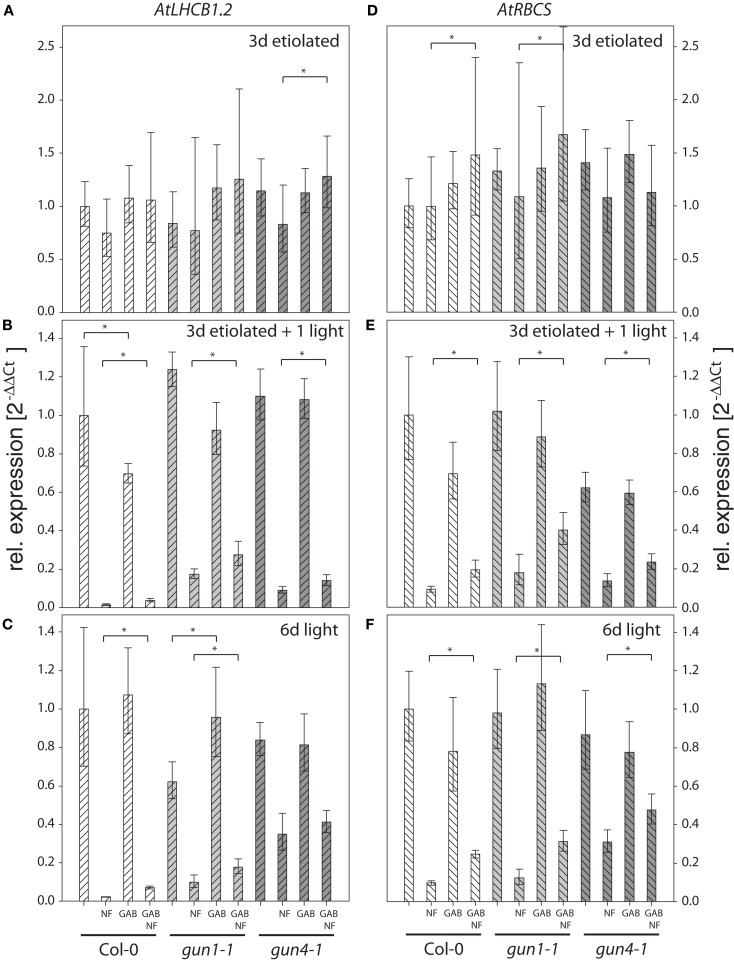
Figure 3.
Quantitative analysis of AtLHCB1.2 (A–C) and AtRBCS (D–F) transcripts in Arabidopsis seedlings fed with gabaculine (GAB) and norflurazon (NF). Seedlings of Arabidopsis wild-type Col-0, gun1-1, and gun4-1 mutants fed with or without 10 μM GAB and 1 μM NF were etiolated for 3 days (A,D), etiolated for 3 days and subsequently illuminated for 1 day (B,E), or germinated in photoperiodic light for 6 day (C,F). AtLHCB1.2 and AtRBCS expression levels were quantified by real-time PCR and calculated by the 2−ΔΔCt method using AtACT2 expression as standard. Expression data are compared to the untreated wild-type Col-0 and shown as means of at least three biological replicates ± SD. * Indicates a significant difference of pairs indicated by brackets at a level of P < 0.05. Tested were GAB-treated samples vs. untreated and GAB and NF treated vs. NF-treated samples within each genotype.

