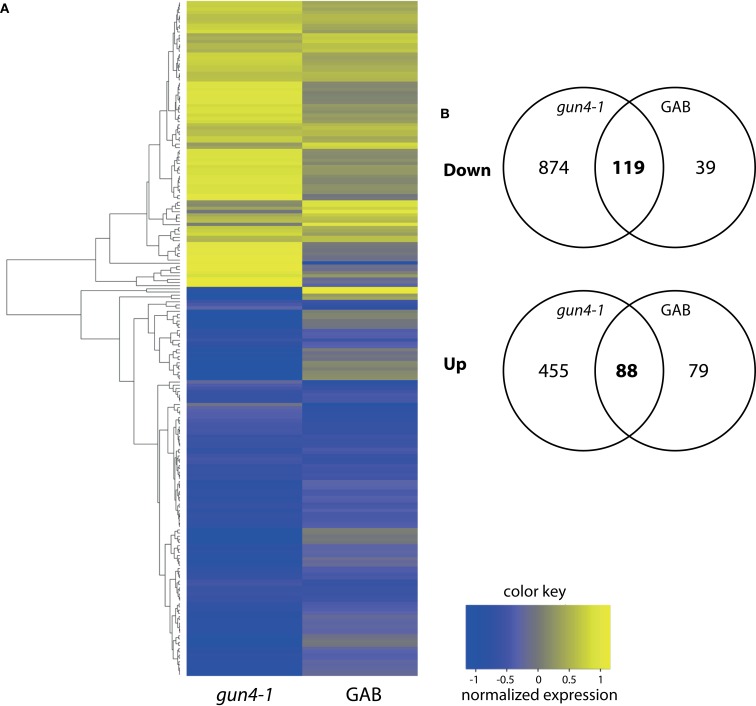
Figure 5.
(A) Heatmap analysis of differentially expressed genes in GAB-treated Arabidopsis wild-type Col-0 or gun4-1 mutants 6 h after illumination of etiolated seedlings. All genes showing a fold change of <2/3 or >3/2 and a P-value of <0.05 in both conditions were analyzed. (B) Venn diagrams summarizing changes of transcript abundance in GAB-treated Arabidopsis wild-type Col-0 or gun4-1 mutants 6 h after illumination of etiolated seedlings. The intersections of the circles represent the number of genes whose transcript abundance was decreased (“Down”) or increased (“Up”) in both compared to the untreated Arabidopsis wild-type Col-0.

