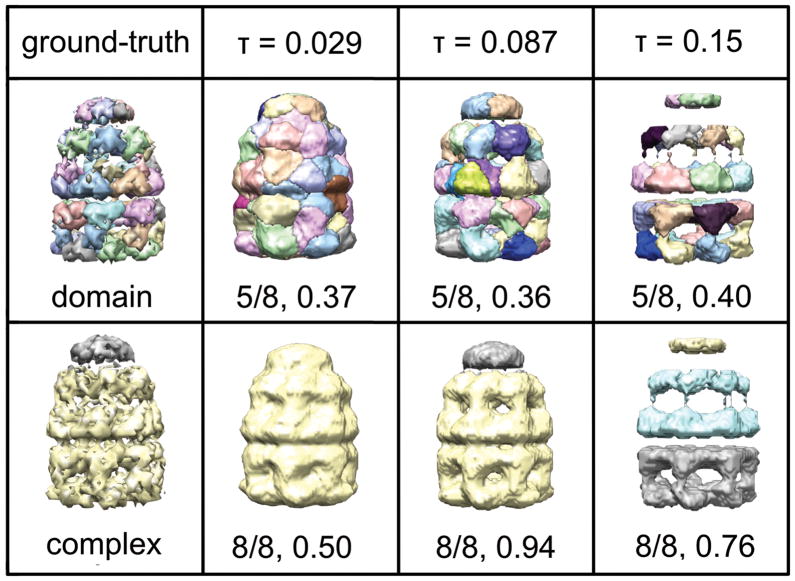
Figure 5. Segmentation of GroEL+GroES at 23.5 Å at three intensity thresholds, τ.
The threshold τ = 0.087 is our computed default threshold for this map. The threshold τ = 0.029 is the contour level recommended for visualization in the EMBD (1046). The first rows shows the resulting segmentation at the hierarchy level scoring highest for the domain-based ground truth partitioning of GroEL+GroES, and the second row shows the resulting segmentation at the hierarchy level scoring highest for the component-based ground truth partitioning of GroEL+GroES. For each segmentation, the hierarchy level out of the total number of levels is given.

