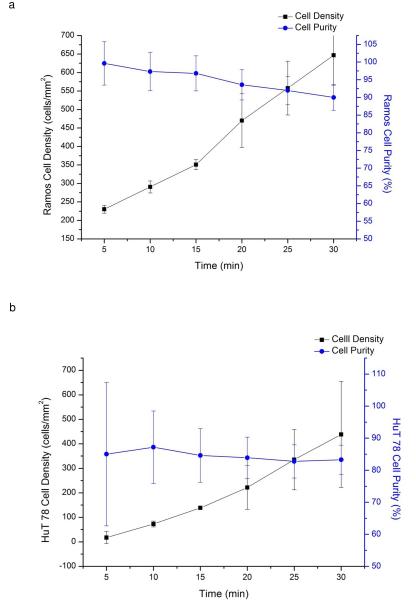
Fig. 4.
a) Change in Ramos cell capture density (black squares) and purity (blue circles) over time, indicating the chip is capable of positive selection of target cells. As the captured cell density increases over time, the likelihood of nonspecific binding also increases as target cells cover the affinity surface. As a result, cell capture purity begins to decline at longer separation times. b) Change of HuT 78 cells capture density and purity over time. As in the case of anti-CD19 capture of Ramos cells, HuT 78 cell purity decreases at longer separation times and higher cell capture density. A mixture of Ramos cells and HuT 78 cells introduced into the chip under continuous flow conditions. The mixture concentration was 3600±1120 cell/μL; (43% HuT 78 cells).

