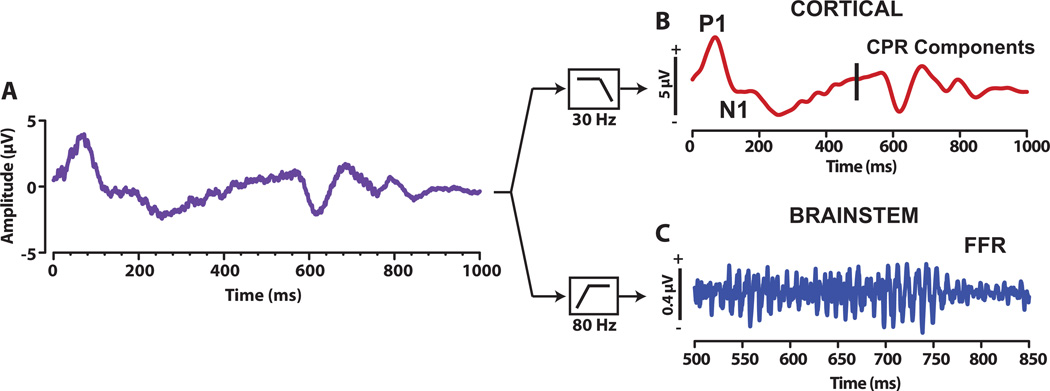
Fig. 2.
Illustration of the derivation of cortical and brainstem response from the EEG. For each participant, the raw EEG was recorded with online filters set between 0 and 5000 Hz, epoched, and averaged (panel A). This averaged waveform was then either low-pass filtered (1–30 Hz) offline to derive the cortical CPR components (Panel B) or band-pass filtered (80–1500 Hz) to derive the brainstem FFR (panel C). The vertical line at 500 ms marks the onset of the pitch eliciting segment of the stimulus.

