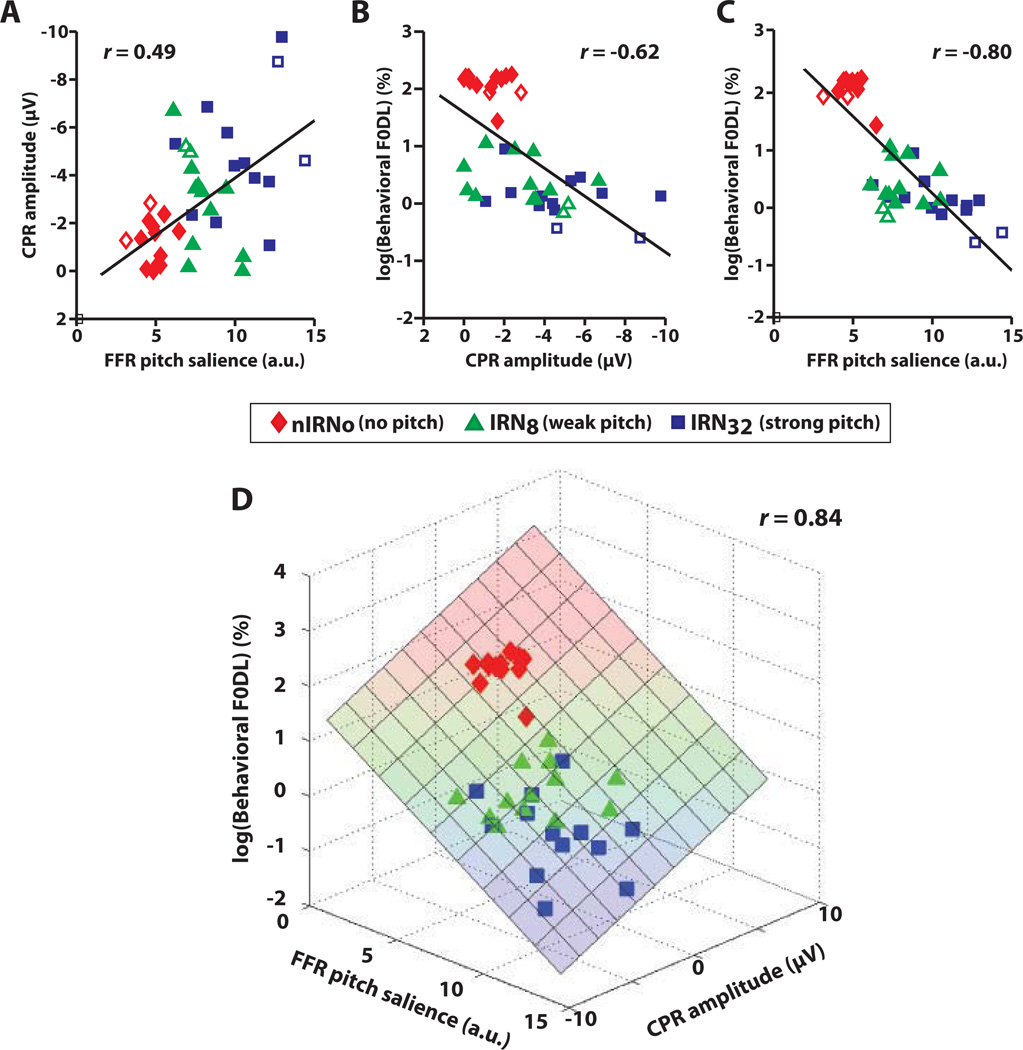
Fig. 9.
Comparison of neural and behavioral measures of pitch salience. Pair-wise regressions between neural and perceptual measures: (A) brainstem FFR vs. cortical CPR; (B) CPR vs. behavioral F0 DLs; (C) FFR vs. F0 DLs. In panels A–C, observe that stimuli with no pitch (IRNo; red diamonds) or weak pitch salience (IRN8; green triangles) cluster away from stimuli with high pitch salience (IRN32; blue squares). Also, note the open symbols for data points from the two trained musicians. (D) Simultaneous correlations between all three response measures. Weaker representation of pitch in brainstem (FFR) and early cortical processing (CPR) is associated with poorer perceptual performance (i.e., larger DLs; upper portion of the plane), whereas stronger neural representations at both levels are associated with improved performance (i.e., lower DLs; lower portion of the plane). These correlations suggest that a listener’s pitch discrimination ability is predicted, at least in part, by how well pitch cues are represented in the brainstem and the auditory cortex.

