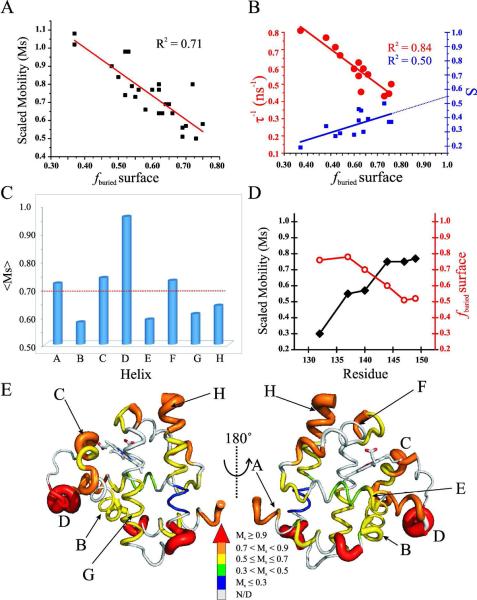
Figure 3.
Mapping fast backbone motion in myoglobin with SDSL. (A) Correlation of scaled mobility (Ms) with fraction of surface buried (see Methods). (B) Correlation between rate (τ−1) and order of motion (S) of R1 with local fraction of surface buried. (C) Mean Ms value per helical segment. The dashed red line indicates the overall average value. (D) Ms values and local fraction of surface buried for residues within the H-helix. (E) Cartoon representation of myoglobin indicating the mobility of the nitroxide as judged by the Ms values. The width and color of the backbone are proportional to Ms (N/D: not determined).

