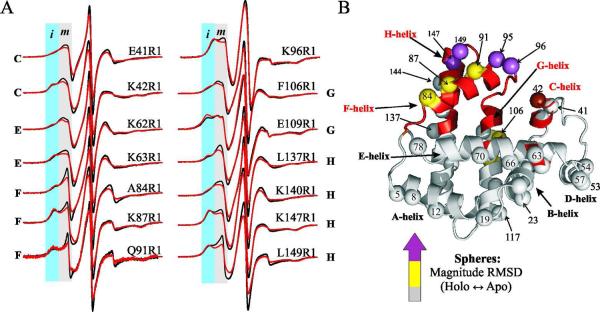
Figure 6.
Conformational exchange in NApo. (A) EPR spectra of R1 at sites exhibiting osmotic shifts. The spectra recorded in Ficoll 70 and in sucrose are shown in black and red, respectively. The light blue and gray areas identify regions where relatively immobile and mobile states of the nitroxide, respectively, contribute to the intensity. (B) Ribbon diagram of myoglobin showing regions identified to be in conformational exchange as a red ribbon and relative RMSD values from Figure 5B as color coded spheres at Cα: gray, RMSD < <RMSD>; yellow, <RMSD> ≤ RMSD ≤ <RMSD> + σ; magenta, RMSD > <RMSD> + σ, where σ is the standard deviation from the mean.

