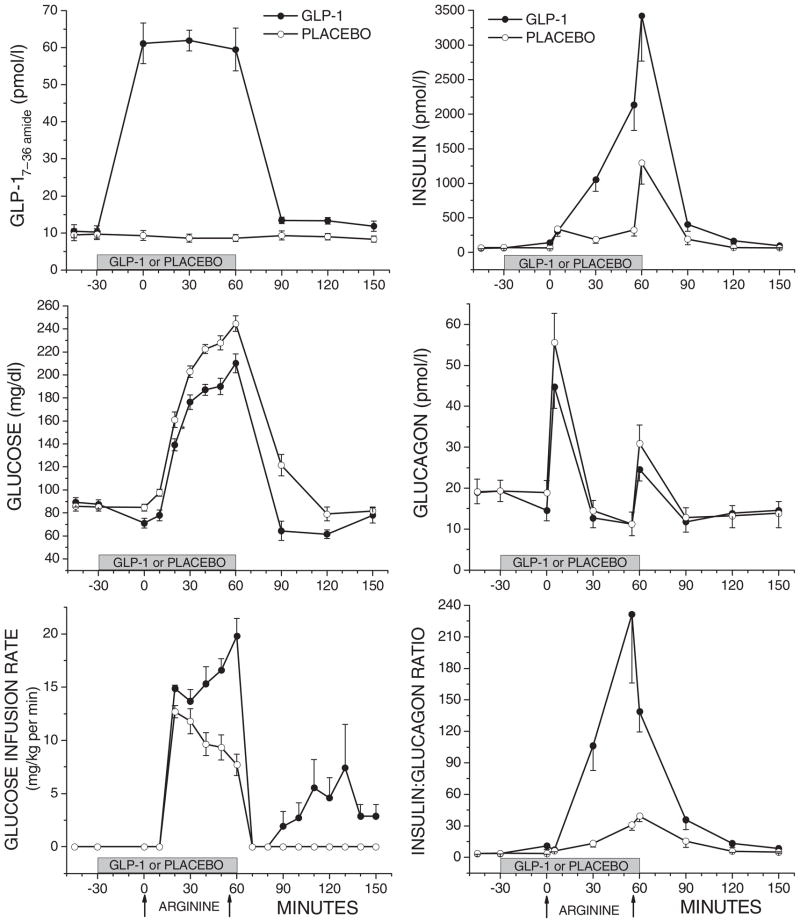
Figure 1.
Results during and after the glucose-potentiated arginine test under GLP-1 (-●-) or placebo (-○-) infusion. On the left are plasma levels of GLP-1, glucose and the glucose infusion rate during (t = 0–60 min) and after (t = 60–150 min) testing. On the right are corresponding plasma levels of insulin, glucagon and the insulin:glucagon ratio. To express glucose in mmol/l, multiply it by 0.0551.

