
Fig. 6.
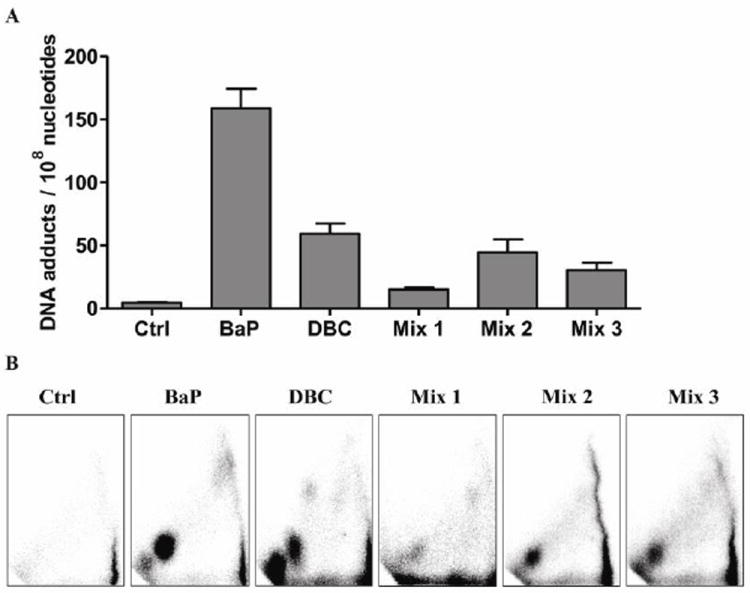
DNA adduct formation in FVB mouse skin tissue 12 h post-treatment with 200 μl toluene (Ctrl), 400 nmol (100 μg) BaP, 4 nmol (1.2 μg) DBC, 1 mg DPE (mix 1), 1 mg DPE + 1 mg CTE (mix 2), or 1 mg DPE + 1 mg CTE + 2 mg CSC (mix 3). DNAadducts were measured by the nuclease P1 enrichment version of 32P-postlabeling method. (A) Bars represent mean ± SD, N=5 pools, 2 mice/pool. Total adducts were measured across the DRZ, diagonal radioactive zone of the TLC autoradiogram. (B) Representative autoradiograms showing DNA adduct profiles.