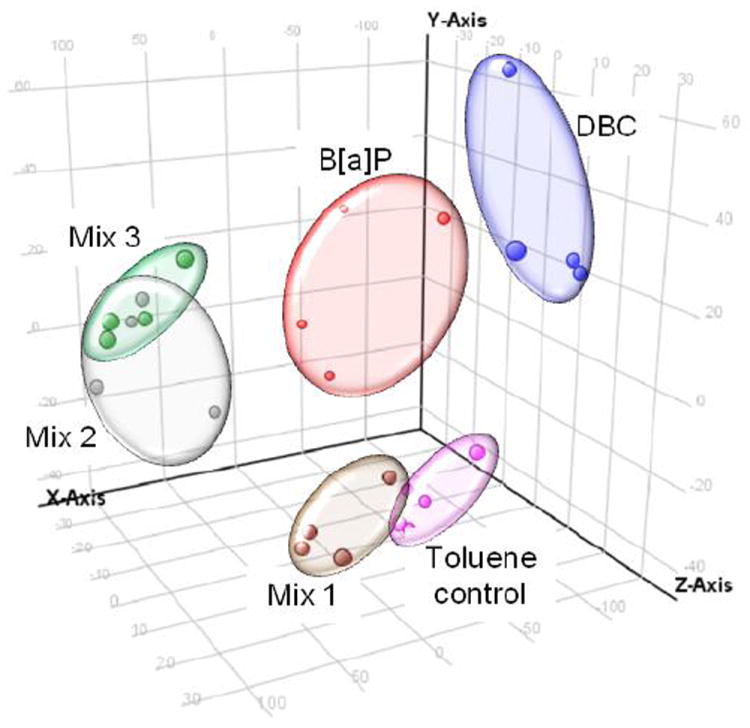
Fig. 7.

Principal components analysis of gene expression data by treatment. Each data point represents a biological replicate (N=4 per treatment). All genes differentially regulated (p<0.05) between treated and toluene control were included in analysis. Replicates cluster based on treatment group. Toluene control = pink; Mix 1 = brown; Mix 2 = gray; Mix 3 = green; B[a]P = red; DBC = blue.
