
Fig. 8.
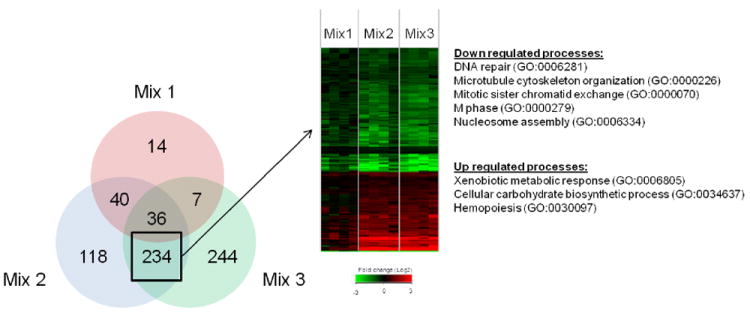
Comparison of differentially expressed genes among PAH mixture treatments by Venn diagram (A). Values represent genes significant (p<0.05) versus toluene control. Genes common between mix 2 and mix 3, but unique from mix 1 are shown as a heatmap (B). Values in heatmap are fold-change (Log2) compared to toluene control (red is up regulated, green is down regulated and black is no change). GO biological processes significantly enriched (p<0.05) for up or down regulated genes are shown.