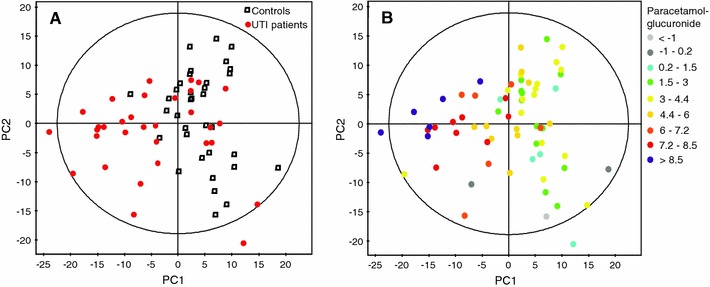
Fig. 1.

PCA scores plot of 1H NMR data from controls and UTI patients urine samples at baseline, first two principal components covering 14.5 and 10.2% of variation respectively. a Colored according to controls (square) and UTI patients (circle). b Colored according to the logarithm of absolute concentration of paracetamol–glucuronide (Color figure online)
