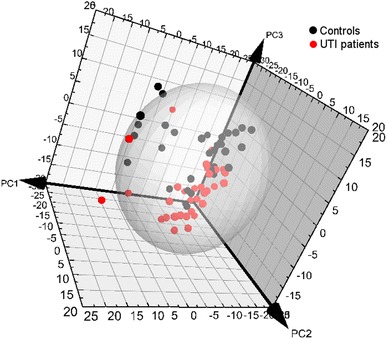
Fig. 2.

PCA scores plots of 1H NMR data from controls (black) and UTI patients (red) urine samples at baseline after removal of the regions corresponding to paracetamol and its metabolites. First principal component covers 11.7%, second 11.2% and third 9.8% of variation (Color figure online)
