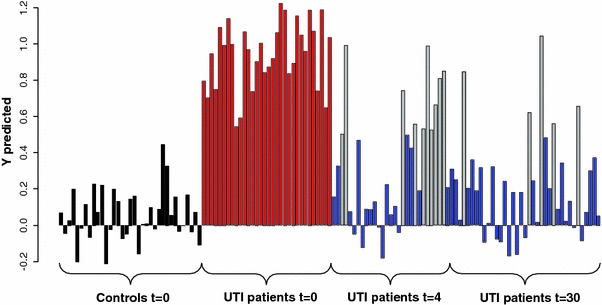
Fig. 4.

Predicted response value for two-class PLS-DA model based on controls (black bars) and UTI patients (red bars) at baseline: blue bars are the t = 4 and t = 30 classified as controls, grey are the t = 4 and t = 30 samples classified as UTI patients at t = 0 (Color figure online)
