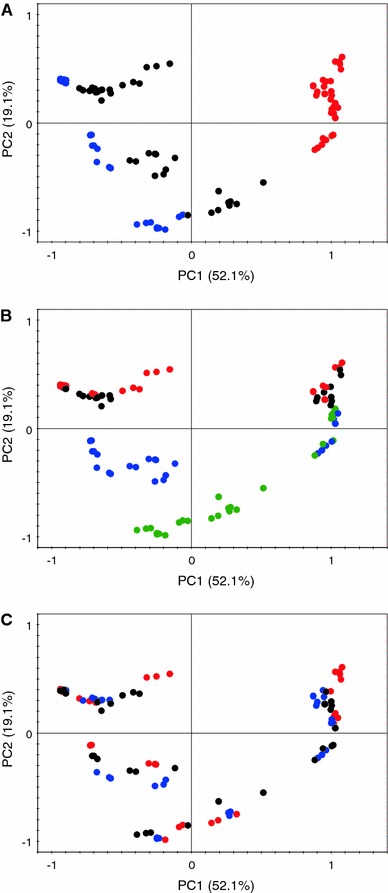
Fig. 2.

The principal component analysis score plots. In a, samples are colored according to SPE fractions where red represents methanol, black represents methanol:water (1:1), and blue represents water fraction. In b, samples are colored according to developmental stages where green represents green stage, blue represents veraison, black represent ripe, and red represents harvest stage. In c, samples are colored according to grape cultivars where red represents samples from Aragonês, blue represents samples from ‘Touriga Nacional’, and black represents samples from ‘Trincadeira’ (Color figure online)
