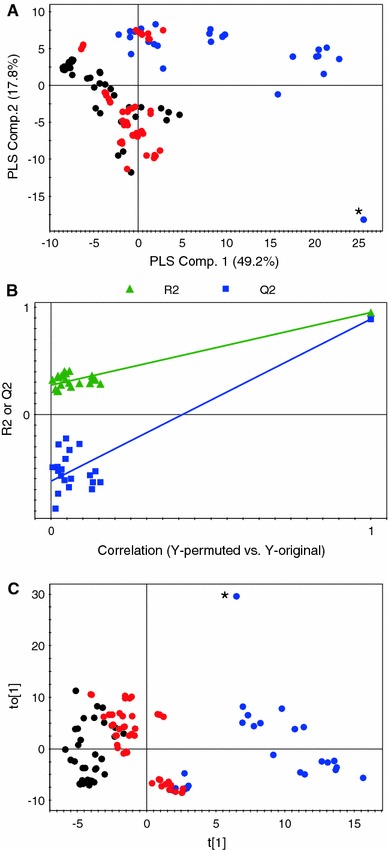
Fig. 5.

The score plots of PLS (a) and O2PLS (c) are represented. Samples with black color are of low anti-TNFα activity while samples with red and blue colors are of medium and high anti-TNFα activity, respectively. The permutation test for PLS (b) is also presented (Color figure online)
