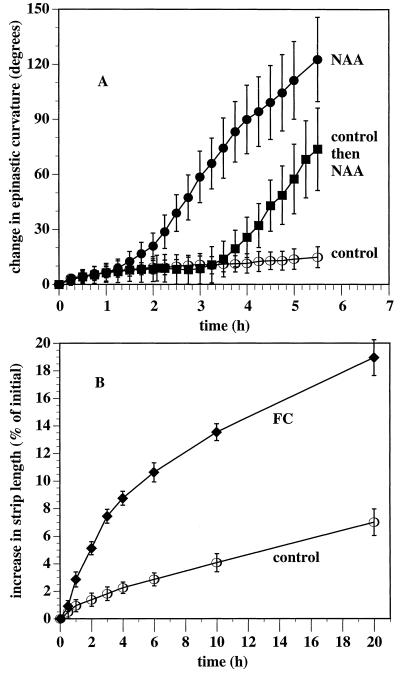
Figure 3.
Short-term effect of NAA on tobacco leaf-strip curvature (A) and longer-term effect of FC on strip length (B). In A, 10 strips were each anchored by one end to small rubber blocks in a Petri dish and incubated in control solution (○) (10 mm Suc, 10 mm KCl, and 0.5 mm Mes/BTP [pH 6.0]) or the same solution also including 10 μm NAA (•), or first in control solution for 2 h followed by NAA (▪). Images of the strips were captured every 15 min and curvature was recorded relative to curvature at time 0. In B, 18 strips per treatment were incubated in the same control solution (○) or the same solution plus FC (♦) for 20 h. At each time point they were gently removed from solution, their lengths measured, and then returned to the incubation solution. Error bars indicate 95% confidence limits for mean change (Student's t test) from time 0.

